“C’s get degrees” might be literally true (if a little facetious) when used by a student in reference to their studies—but should we apply that principle to housing?
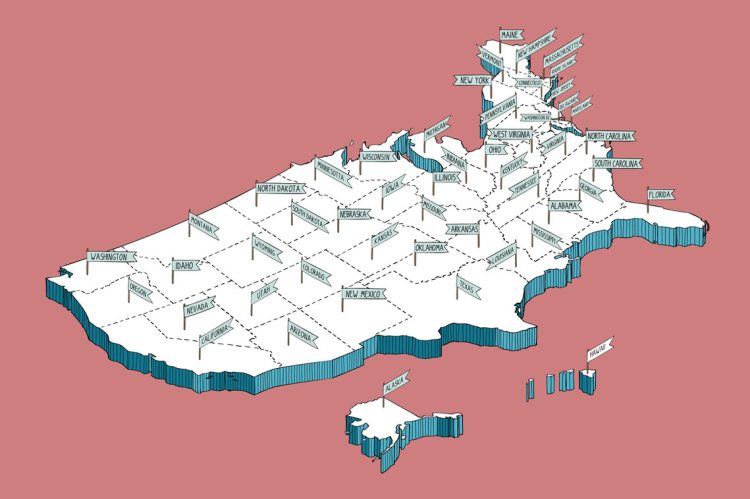
To assess how strongly housing affordability struggles are being felt across the U.S., Realtor.com® has released “report cards” for all 50 states and the District of Columbia. Each state is assigned a score out of 100 and a corresponding letter grade for how affordable housing is in the state.
The grade is calculated based on four metrics, two measuring housing affordability, and two measuring construction:
- Realtor.com’s own affordability score, measured by comparing what percent of inventory is affordable to households in a state, graded on a scale between 0 to 2 (25% of the score)
- How much of a median earner’s income is spent on a median-priced listing (25% of the score)
- Ratio of permits to population in the state (40% of the score)
- The premium paid for new construction (10% of the score)
None of the states received an A+ grade, which the report described as a sign of “how far we still have to go to make homeownership truly attainable.”
South Carolina is the only state to achieve an A grade, while Iowa and Texas both received an A-.
The top 3 highest-graded states were found in the South or Midwest:
- South Carolina (75.2/A): The state’s affordability score of 0.65 is described as “middle-of-the-pack,” but its construction metrics make up the difference. The state was home to 3.2% of U.S. building permits in 2024, compared to how it houses 1.6% of the U.S. population. The premium for new construction compared to existing is also in the negative, at -8.2%.
- Iowa (71.6/A-): In 2024, Iowa had the highest Realtor.com Affordability score at 0.92.
- Texas (71.5/A-): Of the 50 states and D.C., Texas had by far the highest number of U.S. building permits in 2024 (15.3%).
The only Southern state that fell in the bottom half is Mississippi, ranked 37 out of 51. Mississippi has a low median income of $55,030. It also held 0.9% of the U.S. population in 2024, but only 0.5% of permits.
In pure affordability terms, outliers in the South include Florida, Tennessee and North Carolina, which all have lower affordability scores than other Southern states. These states all share high median listing prices, especially compared to median income:
- Florida: median listing price of $445,826; median income of $69,226
- Tennessee: median listing price of $433,987; median income of $66,631
- North Carolina: median listing price of $408,663; median income of $68,774
However, these three states all still fall within the top half of the grades (the lowest is Tennessee, ranked 25 with a C grade), helped by positive construction to population ratios. Hence, North Carolina is still one of the top five most affordable states by the report’s metrics.
The 10 lowest-graded states were all in the West or the Northeast, which face high median listing prices and low/insufficient construction to meet demand.
- Wyoming (41.2/C-): One of the lowest numbers of permits (0.2%) and population (0.1%) in the country. Median listing price ($465,295) is much higher than median income $73,733.
- Alaska (40.4/C-): Alaska has an identical permit/population ratio to Wyoming. Median income is slightly higher ($86,275), and median listing price is slightly lower ($417,738).
- Montana (35.2/D): The lowest rated on the Realtor.com affordability score (0.4), Montana boasts a high median listing price ($634,523), and the lowest median income of the bottom 10 at $69,683.
- Oregon (29.8/F): The permit population ratio is slightly titled toward population (1.3% to 1.0%). Median listing price is $563,896, while median income is relatively lower at $78,022.
- Connecticut (28.3/F): Population size (1.1%) was more than half the building permits in the state during 2024 (0.4% of U.S. permits). There is also a noticeable premium on new construction, 68.2%.
- California (19.5/F): Despite a relatively high share of 2024 building permits (6.8% in the country), the ratio is still heavily skewed toward population (11.8% of the country), suggesting insufficient supply in California housing.
- Hawaii (15.8/F): Hawaii has the highest median listing price of all 50 states, at $822,065. The population size is 0.4% of the U.S., but the state has only 0.2% of permits.
- New York (13.2/F): Similar to California, the state’s ratio of 2024 building permits (3.1%) is outpaced by its population size (5.8% of the country).
- Massachusetts (12.6/F): Massachusetts has one of the higher median incomes in the country ($96,584), but also one of the higher median listing prices ($781,758). Population to permit ratio is almost two-to-one (2.1% of U.S. population, 1% of building permits).
- Rhode Island (12.2/F): Bordering Massachusetts and Connecticut, Rhode Island has a lower listing price ($537,521), but was home to only 0.1% of building permits in 2024. Premium on new construction is slightly higher than Massachusetts’ as well (43.8% compared to 42.8%).
Northeast and Midwest states also have some of the highest premiums on new construction, which could further add to the regions’ unaffordability:
- Kansas: 105.9% premium on new construction
- Michigan: 96.4% premium
- Ohio: 91.1% premium
- Pennsylvania: 89.9% premium
- New York: 76.2% premium
“The only real solution to housing affordability is to build more homes,” said Realtor.com® CEO Damian Eales in a press release about the report. “Some states are making progress, but too many others are stuck in a cycle of soaring housing costs and limited inventory. With this report and the Let America Build campaign, we’re shining a spotlight on these gaps. We need bold solutions, and we urge federal, state and local leaders to step up and take action now.”
For the full report, click here.


