
 The recent release by the Federal Housing Finance Agency (FHFA) shows that its measure of house prices, House Price Index—Purchase Only, rose by 5.4 percent on a 12-month seasonally adjusted basis in December 2014. This marks the 35th consecutive month of year-over-year growth. Over this nearly three-year period, house prices have risen by 20.0 percent and have now surpassed their November 2005 level.
Similarly, the recent release from Standard and Poor’s (S&P) and Case-Shiller indicates that their measure of house prices, the House Price Index—20 City Composite, rose by 4.5 percent on a year-over-year seasonally adjusted basis. This is the 31st consecutive month of year-over-year increases in the house price index. Over this period of more than two-and-a-half years, house prices have risen by 24.9 percent. This version of the S&P/Case-Shiller House Price Index is now just above its November 2004 level.
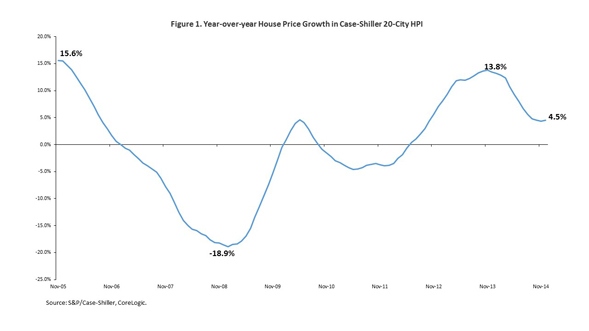
According to the S&P/Case-Shiller—20 City Composite House Price Index, year-over-year house price growth was slowing in recent months. In each month between December 2011 and November 2013, excluding June 2013, the 12-month change in house prices was higher than the previous month. Year-over-year house price growth peaked at 13.8 percent in November 2013. However, as Figure 1 below illustrates, annual house price growth was 4.5 percent in December 2014.
In addition to metro-wide house price indexes, Standard & Poor’s also calculates tiered house price indexes for 16 of the 20 metro areas included in the House Price Index—20 City Composite. Tiered indexes measure changes in the value of existing single-family houses in three price tiers—low, middle, and high. Each tier represents approximately one-third of the sales transactions in each respective market.
A previous post http://eyeonhousing.org/2013/10/house-price-growth-highest-in-7-years/ brought attention to the gap between house price growth in low-tier homes and high-tier homes, noting that the wide gap between price appreciation in low-tier and high-tier homes was inconsistent with the historical trend, and that the closing of this gap would signal a return to normal house price growth. Building on that premise, more recent work illustrated that the gap between the growth rate of low-tier house prices and the growth rate of high-tier house prices had shrunk across all cities, but more so in cities where the gap was the widest.
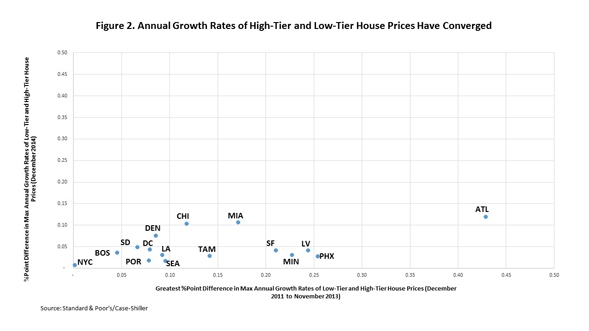
Not only has the gap between the growth rates of low-tier and high-tier home prices now shrunk, but for many of the 16 cities for which data is available, the gap has converged to 5 percentage points or less. Figure 2 makes this point. The x-axis represents the percentage point difference between the maximum annual growth rate of low-tier house prices between December 2011 and November 2013, when the 20-City House Price Index was almost continuously accelerating, and the maximum annual growth rate of high-tier house prices over the same period. The y-axis depicts the percentage point difference between annual growth rates of low-tier and high-tier house prices in the current month, December 2014.
According to the chart below, between December 2011 and November 2013, the period when the 20-City House Price Index was almost continuously accelerating, the percentage point difference between the maximum annual growth rates of low-tier and high-tier house prices over this 24-month period varied widely across cities. In New York City, the maximum low-tier and high-tier house prices were similar, 6.3 percent and 6.1 percent respectively, but only one other city, Boston, recorded a gap of 5 percentage points or less. In Atlanta, the largest annual growth rate of low-tier house prices exceeded the maximum growth rate of high-tier house prices by 42.9 percentage points, 56.7 percent maximum growth rate in low-tier house prices as compared with a 13.8 percent maximum growth rate in high-tier house prices.
However, by December 2014, not only had the annual growth rate differential narrowed for all 16 cities, but in 12 of the 16 cities, the differential had declined to 5 percentage points or less. For example, in Phoenix, the annual growth rate differential during the period of accelerating national house price growth was 25.4 percentage points, low-tier house prices recorded a maximum growth rate of 43.8 percent while high-tier house prices experienced a maximum growth rate of 18.3 percent. However, by December 2014, the gap had shrunk to 2.6 percentage point as low-tier house prices rose by 3.4 percent over the year while high-tier house prices grew by 0.7 percent.
View this original post on NAHB’s blog, Eye on Housing.


