NAHB tabulations of the Census Bureau’s quarterly tax data show that $527 billion in taxes were paid by property owners from the fourth quarter of 2014 through the end of third quarter of 2015. This represents a $37 billion increase over the previous trailing four-quarters, or a nearly 7.5 percent gain, the largest growth since 2010.
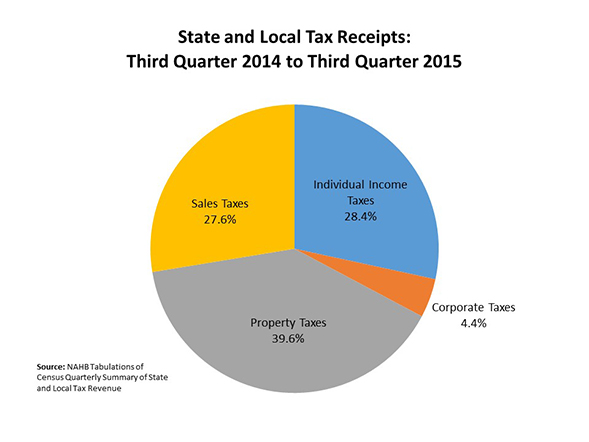
Property taxes accounted for 39.6 percent, the largest share, of state and local tax receipts among major sources over the past four quarters, followed by individual income taxes (28.4 percent), sales taxes (27.6 percent), and corporate taxes (4.4 percent).
Gains for state and local non-property tax collections have outpaced increases in property tax receipts in recent years, as non-property tax receipts declined greatly during the recession. It pushed the property tax share of total tax revenue from the four major sources from a high of 44.9 percent in the third quarter of 2010 to 39.6 percent as of the third quarter of 2015. The current share is still higher than the pre-housing boom average of 37 percent(on a four-quarter basis) for the period of 2001 – 2003.
The share of property tax among four major tax sources is changing with the fluctuations in non-property tax collections. Non-property tax receipts including individual income taxes, corporate income taxes, and sales taxes are affected by the business cycle, while property tax collection is relatively stable as state and local governments could smooth the collections through lagging assessments and annual adjustments.
This post was originally published on NAHB’s blog, Eye on Housing.