

 In Q3, 20,050 U.S. residential properties in the foreclosure process—but not yet repossessed by the foreclosing lender—were vacant “zombie” homes as of the end of the third quarter of 2015, down 27 percent from the previous quarter and down 43 percent from a year ago. This news comes from the recently released RealtyTrac®Q3 2015 U.S. Zombie Foreclosure and Vacant Property Report.
Vacant residential properties in the foreclosure process accounted for 1.3 percent of all vacant U.S. residential properties, with bank-owned homes (REO) accounting for another 1.9 percent of all vacant 1 properties as of the end of the third quarter.
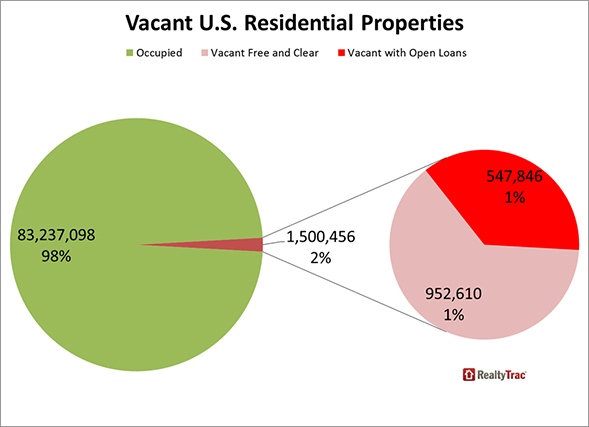
The report shows a total of 1.5 million (1,500,456) vacant U.S. residential properties, 1.8 percent of all 84.7 million U.S. residential properties. Among the 1.5 million vacant residential properties, 36.5 percent have at least one open loan and 6.2 percent are seriously underwater, meaning the combined value of loans secured by the property is at least 25 percent more than the estimated market value of the property.
“The overall inventory of homes in the foreclosure process has dropped 36 percent over the past year so it’s not too surprising to see a similarly dramatic drop in vacant zombie foreclosures,” says Daren Blomquist, vice president at RealtyTrac. “What is surprising is there are so many vacant homes where the homeowners do not appear to be in financial distress—with only 3 percent in foreclosure or bank owned, and only 6 percent that are underwater. More than 63 percent of these vacant homes are not even encumbered by a loan, owned free and clear by the owner. The fact that the homeowners are not selling given the recovering real estate market in most areas indicates that many of these properties are in poor condition and in neighborhoods that have been left behind by the housing recovery.”
Markets with most vacant ‘zombie foreclosures’
States with the most vacant “zombie” foreclosures were New Jersey (3,997), Florida (3,512), New York (3,365), Illinois (1,187) and Ohio (1,028).
States with the highest share of vacant “zombie” foreclosures as a percentage of total vacant properties were New Jersey (9.4 percent), New York (8.2 percent), Nevada (2.7 percent), Massachusetts (2.5 percent), and Illinois (2.1 percent).
Only six states posted a year-over-year increase in zombie foreclosures, most notably Massachusetts (up 66 percent) and New Jersey (up 29 percent).
Among metropolitan statistical areas with at least 100,000 total residential properties, those with the most vacant “zombie” foreclosures were New York (3,531), Philadelphia (1,610), Chicago (989), Tampa (984), and Miami (866).
Major metro areas with the highest share of vacant “zombie” foreclosures as a percentage of all vacant properties were Rochester, N.Y. (14.3 percent), Trenton, N.J. (10.5 percent), New York (10.0 percent), Albany, N.Y. (7.9 percent), and Allentown, Pa. (5.2 percent).
Among the 147 metro areas with at least 100,000 total residential properties, there were 21 that bucked the national trend and posted a year-over-year increase in vacant “zombie” foreclosures, including Boston (up 61 percent), Worcester, Mass. (up 43 percent), St. Louis (up 16 percent), Philadelphia (up 15 percent), and Trenton, N.J. (up 11 percent).
Markets with most total vacant properties
States with the most total vacant residential properties were Florida (180,846), Michigan (117,833), Texas (117,350), Ohio (86,416), and California (80,750).
States with the highest percentage of vacant residential properties were Michigan (3.9 percent), Indiana (3.0 percent), Mississippi (2.8 percent), Florida (2.7 percent), and Alabama (2.6 percent).
Among metropolitan statistical areas with at least 100,000 total residential properties, those with the most vacant residential properties were Detroit (84,291), Miami (67,139), Chicago (48,181), Atlanta (36,396), and New York (35,200).
Major metro areas with the highest percentage of vacant residential properties were Flint, Michigan (7.5 percent), Detroit (5.5 percent), Youngstown, Ohio (4.4 percent), Beaumont-Port Arthur, Texas (4.2 percent), and Atlantic City, New Jersey (4.1 percent).
Markets with the fewest vacant properties
States with the lowest percentage of vacant residential properties were South Dakota (0.3 percent), New Hampshire (0.4 percent), Vermont (0.5 percent), North Dakota (0.5 percent), Montana (0.8 percent) and Washington (1.1 percent).
Among metropolitan statistical areas with at least 100,000 total residential properties, those with the lowest share of vacant residential properties were San Jose, Calif. (0.3 percent), Fort Collins, Colo. (0.3 percent), Manchester, N.H. (0.4 percent), Lancaster, Pa. (0.4 percent), and Fayetteville, Ark. (0.4 percent).
States with most vacant properties underwater
States with the most vacant properties seriously underwater were Florida (16,723), Ohio (9,237), Illinois (7,397), New Jersey (6,306), and California (5,187).
States with the highest percentage of vacant homes underwater were New Jersey (14.9 percent), Maryland (13.1 percent), Illinois (12.9 percent), Nevada (11.7 percent), and Ohio (10.7 percent).
Among metropolitan statistical areas with at least 100,000 total residential properties, those with the most vacant residential properties seriously underwater were Chicago (6,638), Miami (5,546), New York (3,952), Detroit (3,739), and Cleveland (3,488).
Major metro areas with the highest share of vacant homes underwater were Trenton, N.J. (21.4 percent), Columbus, Ohio (19.1 percent), Cleveland, Ohio (17.2 percent), Fresno, Calif. (16.5 percent) and Atlantic City, N.J. (15.2 percent).
For more information, visit www.realtytrac.com.