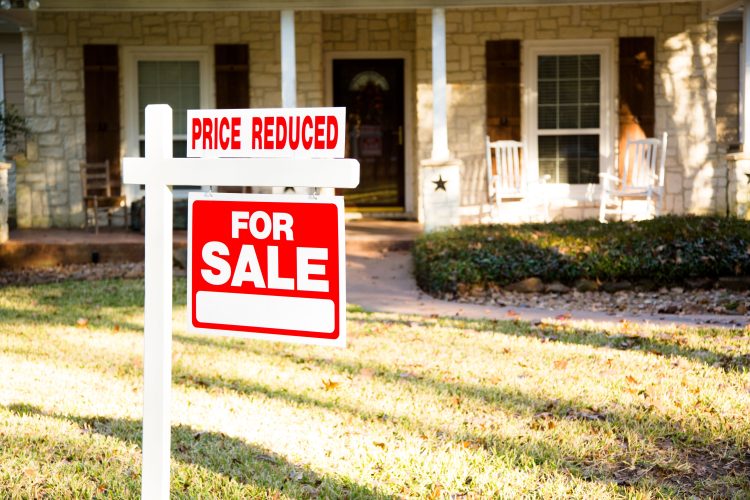
The housing market is entering a new phase, with nearly 20% of homes reducing their asking prices in September as inventory continues to climb and buyers gain more leverage, according to Realtor.com®’s September Monthly Housing Trends report.
Notably, this trend is only showing in lower- and mid-tier-priced homes, as luxury home prices remain largely untouched, with reductions least common at the top of the market, according to the report.
Homes priced between $350,000 and $500,000 experienced the highest rate of price reductions at 21.6%, while luxury properties over $1 million saw cuts on just 13.3% of listings.
“September’s trends show a housing market increasingly tilting in buyers’ favor, with a rising inventory of homes for sale, longer days on market and more competitive pricing,” said Danielle Hale, chief economist at Realtor.com. “While market power varies across regions and price tiers, reflecting economic conditions, in many areas momentum is lining up with seasonal price cuts and other advantages, which will make this fall particularly buyer-friendly relative to recent years.”
The data would appear to back up analyses—incluidng one by Realtor.com—that mid-October is the most favorable time for buyers in the current market. But it could also be a worrying sign that an already sluggish housing market is under more stress due to macro factors.
Regional variations in price cuts were notable, with the South leading the way with 21.1% of listings seeing price cuts, followed by 20.9% in the West. Meanwhile, the Northeast showed the most stability with just 14% of listings reducing prices.
Individual metro variations were even more pronounced. Denver topped the list with 30.7% of listings cutting prices, followed by Portland, Oregon, at 30.2% and Indianapolis at 29.7%.
For the 23rd consecutive month, active inventory rose year-over-year, climbing 17% compared to September 2024, maintaining the amount of homes for sale above 1 million for the fifth month in a row.
Despite overall gains, nationwide inventory remains 13.9% below typical 2017 – 2019 levels, indicating that the broader recovery in housing supply has stalled, according to the report.
However, the pace of inventory growth is decelerating. After peaking at 31.5% growth in May, the rate has steadily declined throughout the summer and fall. New listings actually dropped 1.2% from last September, with particularly sharp drops in the South (-3.5%) and West (-0.1%). The Midwest and the Northeast experienced growth, at 2.4% and 1.3%, respectively.
While the median list price held steady at $425,000 in September—flat year-over-year and down just 1.2% from August—this short-term stabilization obscures significant long-term appreciation that continues to challenge affordability.
Since August 2019, the typical list price has surged 36%, while price-per-square-foot has jumped 50.6%.
These affordability challenges are echoed in recent data from ATTOM, which found that median-priced homes are less affordable than the historical average in 99% of U.S. counties surveyed, with homeownership expenses consuming 33.3% of typical wages during Q3 2025. In 34% of counties, home expenses on a median-priced home consumed 43% or more of typical wages, which is considered “seriously unaffordable.”
Additionally, the S&P CoreLogic Case-Shiller Index showed home prices increased just 1.7% year-over-year in July, one of the weakest annual gains in the past decade and below the 2.7% rise in consumer prices, marking the third consecutive month of real housing wealth decline for homeowners.
Regional price trends varied notably in September. The West saw the steepest decline at -3.6% year-over-year, while the Midwest held flat, and the South and Northeast each dipped just -0.4%.
Properties spent a median of 62 days on the market in September—seven days longer than the same month last year. This marks the 18th consecutive month of annual increases in time on market, a clear signal of cooling demand.
Florida metros dominated the list of slowest-moving markets, with Miami homes taking 16 additional days to sell compared to last year, Orlando adding 14 days, and Tampa seeing 13 extra days on market. Las Vegas also experienced a 13-day increase.
For complete metro-level data and additional insights, visit Realtor.com.


