
Home-price growth continues to decelerate from the record highs of recent years. Matching up with the latest Case-Shiller index, the latest data from the Federal Housing Finance Authority (FHFA) found that home-price growth remained slower both monthly and yearly, with some upticks seen regionally.
The FHFA’s House Price Index (HPI) found that home prices rose 0.6% on a monthly basis in November, and were up 1.9% year-over-year. Both stats are up from October’s 0.4% monthly rise and 1.7% yearly rise. Price wise, there was no change from October’s 0.4% increase.
The FHFA HPI differs from the S&P Cotality Case-Shiller Home Price Index in that it tracks home prices across the nine census divisions rather than tracking specific markets. It also uses repeat sales data rather than data across new homes.
Across the nine census divisions, home prices mostly continued to increase, with some small year-over-year decreases:
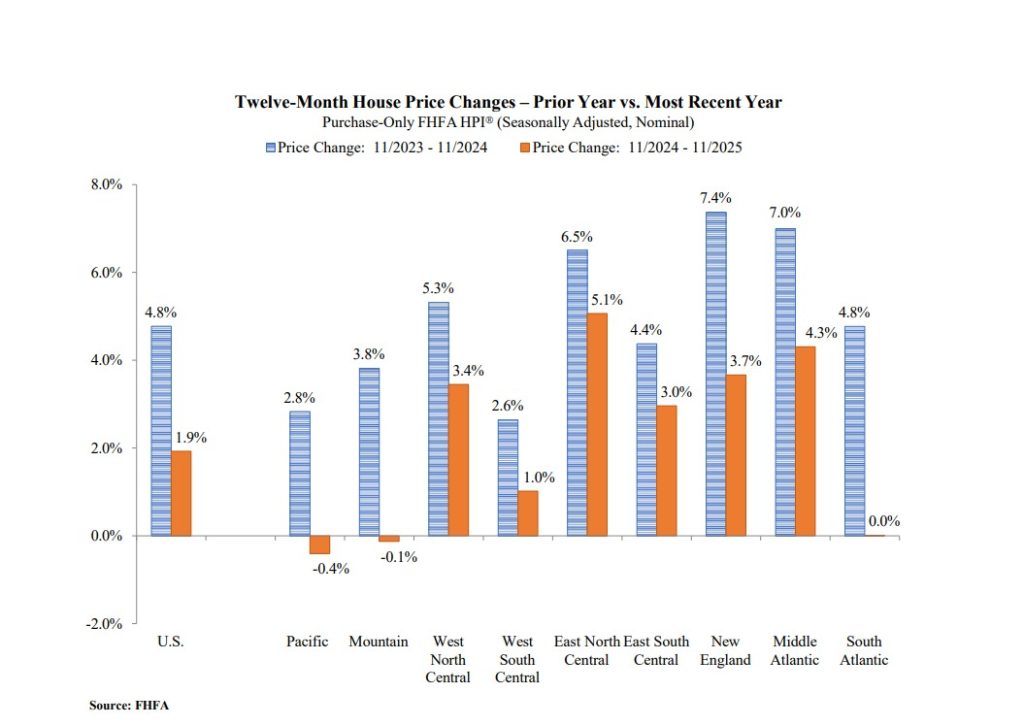
- Pacific: up 0.5% monthly, down 0.4% yearly
- Mountain: up 0.3% monthly, down 0.1% yearly
- West North Central: up 0.3% monthly, 3.4% yearly
- West South Central: up 1% monthly, 1% yearly
- East North Central: up 0.5% monthly, 5.1% yearly
- East South Central: up 1.1% monthly, 3% yearly
- New England: up 0.6% monthly, 3.7% yearly
- Middle Atlantic: no change monthly, up 4.3% yearly
- South Atlantic: up 0.8% monthly, no change yearly
Most of the larger year-over-year increases are in regions with active, high-price markets, such as Massachusetts (New England), New York and New Jersey (Middle Atlantic).
For the larger year-over-year increases seen in the West North Central, East North Central and East South Central regions, the more affordable nature of these markets, and possibly tighter supply, has led to increased demand and competition.
For all census divisions, the FHFA also reported that home price growth has significantly slowed from the previous 12-month period (November 2023 – November 2024).


