
 RealtyTrac’s recently released April 2015 U.S. Home Sales Report analyzed average sales prices and estimated market values at time of sale for single family homes and condos sold in April in 315 U.S. counties to identify the nation’s hottest seller’s markets, best buyer’s markets and those markets evenly balanced between buyers and sellers.
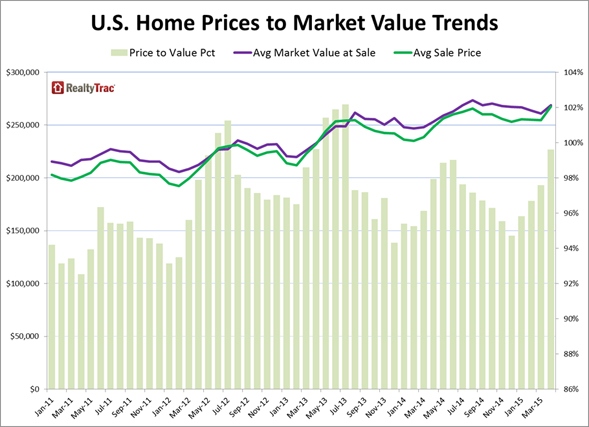
“Nationwide in April single family homes and condos sold for almost exactly 100 percent of their estimated full market value on average—indicating a good balance between supply from sellers and demand from buyers,” says Daren Blomquist, vice president at RealtyTrac. “At the local level, however, most markets tipped in favor of either sellers or buyers—although there were some Goldilocks markets exhibiting a ‘just right’ balance between buyers and sellers.”
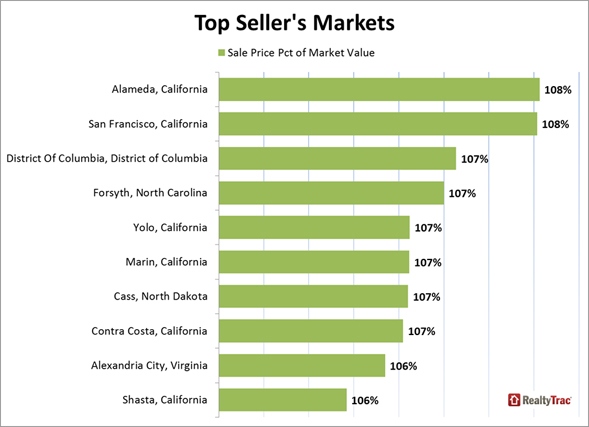
Sellers getting more than market value in 27 percent of markets
· Out of 315 counties nationwide with a population of at least 100,000 and at least 100 sales in April, there were 85 (27 percent) where homes on average sold for at least 101 percent of their estimated full market value—led by Alameda and San Francisco counties in the Bay Area of California (both with average sale prices at 108 percent of estimated full market values), the District of Columbia in the Washington, D.C. metro area (107 percent), Forsyth County, North Carolina in the Winston-Salem metro area (107 percent) and Yolo County, California in the Sacramento metro area (107 percent).
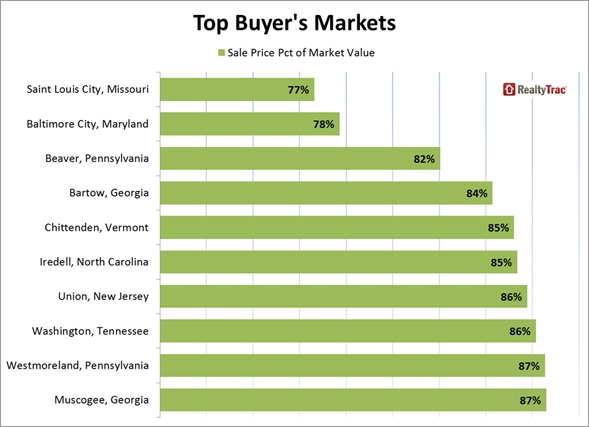
Buyers purchasing below market value in nearly 60 percent of markets
· Out of 315 counties nationwide with a population of at least 100,000 and at least 100 sales in April, there were 186 (59 percent) where homes on average sold for less than 100 percent of their estimated full market value—led by Saint Louis City, Missouri (77 percent), Baltimore City, Maryland (78 percent), Beaver County, Pennsylvania in the Pittsburgh metro area (82 percent), Bartow County, Georgia in the Atlanta metro area (84 percent), and Chittenden County, Vermont in the Burlington metro area (85 percent).
Homes selling at market value in 14 percent of markets
· Out of 315 counties nationwide with a population of at least 100,000 and at least 100 sales in April, there were 44 (14 percent) where homes on average sold for 100 percent of their estimated full market value—including Maricopa County, Arizona In the Phoenix metro area, Riverside County in inland Southern California, Montgomery County, Maryland in the Washington, D.C. metro area, Fulton County, Georgia in the Atlanta metro area, and Wake County, North Carolina in the Raleigh metro area.
Other high-level findings from the RealtyTrac April 2015 U.S. Sales Report
· The U.S. median home sales price was $171,700 in April, down 1 percent from previous month but still up 2 percent from year ago. It was the slowest annual HPA nationwide since April 2012.
· 28.7 percent of all single family and condo home sales in April were all-cash purchases, down from 29.9 percent in March and down from 32.8 percent in April 2014. Metros with the highest share of all-cash purchases were all in Florida: Sarasota (59.4 percent), Cape Coral-Fort Myers, (57.2 percent), Miami (56.5 percent), Tampa (53.0 percent) and Lakeland (47.1 percent).
· 3.7 percent of all single family home sales in April were to institutional investors—entities purchasing at least 10 homes in a calendar year—the same as the previous month but down from 5.5 percent of all single family home sales in April 2014. Metros with the highest share of institutional investor purchases were Charlotte, North Carolina (27.2 percent), Atlanta, Georgia (17.5 percent), Memphis, Tennessee (11.8 percent), Lakeland, Florida (10.2 percent), and Tampa, Florida (9.1 percent).
For more information, visit www.realtytrac.com.


