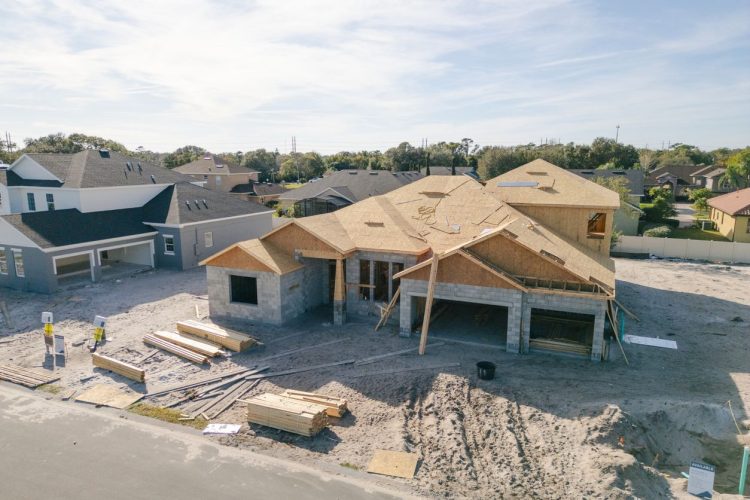
Sales of newly constructed single-family homes were up in April, per the latest findings from the U.S. Census Bureau and Department of Housing and Urban Development.
New single-family homes sold at a seasonally adjusted rate of 743,000 in April, up 10.9% from the revised March figure of 670,000. This is also a 3.3% annual increase from the April 2024 figure of 719,000 homes sold. Odeta Kushi, deputy chief economist of First American Financial Corporation, described these results as higher than “consensus expectations” in a press release.
These results come despite unfriendly buyer conditions such as affordability concerns, high mortgage rates and direct reports of declining consumer confidence in the economy driven in part by tariffs. Buddy Hughes, chairman of the National Association of Home Builders (NAHB), also described the April new-home sales figures as an “anomaly” in a press release.
“A more reliable look would be the year-to-date figures, which show new-home sales are down 1.2% on elevated interest rates, ongoing policy uncertainty and rising construction costs,” claimed Hughes in the press release.
Jake Krimmel, a senior economist at Realtor.com®, said in a press release about the new-home sales figures that:
“Growing new-home sales may seem a bit surprising given affordability concerns in the housing market, but these results are also a continuation of the trend we have seen in new-home sales in recent months, in which less expensive homes are driving sales activity…affordable new builds are the catalyst for growth in the new-home segment.”
Krimmel points to how the median sales price of new houses sold in April ($407,2000) was only 0.8% higher month-over-month and 2% lower year-over-year. (Average sales price, on the other hand, in April was $518,400, up 3.7% from March and 3.6% from April 2024.)
The share of homes sold for under $400,000 increased yet again on a year-over-year basis, which as Krimmel noted in the release is in “direct opposition to trends in the existing home market,” where luxury sales have outpaced others.
The existing home market has also been experiencing rising inventory. In April, the seasonally adjusted estimate of new homes for sale was 504,000. This was down by 0.6% month-over-month, but up 8.6% year-over-year. This comes out to about 8.1 months’ supply of inventory for new homes.
“Rising inventory in the resale market is likely to place pressure on both pricing and sales activity for homebuilders during the second half of the year,” said NAHB Chief Economist Robert Dietz in the association’s press release. “The April new-home data reflects this as new-home inventory is leveling off near a half million of residences marketed for sale, up just 1.6% from January.”
Regional breakdown
The Midwest saw the highest month-over-month percentage increase in new-home sales from March to April: 62,000 to 84,000 new homes sold, or a 35.5% increase. From April 2024 to April 2025, new-home sales in the Midwest increased by only 1.2%.
In raw numbers, the most new homes were sold in the South during this period (478,000). This represented a monthly increase in sales of 11.7% and 6.5% annually. The West came in a distant second to the South for most new homes sold in April (158,000), with marginal monthly (3.3%) and annual (1.3%) increases.
The Northeast saw both the least amount of new homes sold—23,000—and an outright decline in sales both monthly (a 14.8% drop) and annually (25.8%). Commenting on the Northeast regional figures, Krimmel said: “The housing supply gap is most pronounced in the Northeast, so the continued slowdown in new-home sales there is unwelcome news.”
For the full new-home sales report, click here.


